
The most popular data analysis software is often debated. Different tools cater to different needs.
Data analysis is essential in today’s data-driven world. Businesses and researchers rely on it to make informed decisions. With so many options available, finding the right software can be challenging. From handling vast datasets to providing insightful visualizations, the right tool can make a significant difference.
Some software is user-friendly, while others offer advanced features for experts. Understanding what makes a data analysis tool popular can help you choose the best one for your needs. In this post, we will explore the factors that contribute to a software’s popularity and why certain tools stand out in the field of data analysis.

Credit: odsc.medium.com
Introduction To Data Analysis Software
Data analysis software helps businesses make sense of their data. It transforms raw data into valuable insights. This software is essential in our data-driven world.
Importance In Modern Business
In modern business, data analysis software is crucial. It helps companies understand customer behavior. It also optimizes operations and predicts future trends.
Using data analysis software, businesses can make informed decisions. This leads to better strategies and improved performance. It also gives a competitive edge in the market.
Criteria For Popularity
Several factors determine the popularity of data analysis software. Let’s explore these criteria:
- Ease of Use: User-friendly interfaces attract more users.
- Functionality: Comprehensive features are essential.
- Integration: Compatibility with other tools is a must.
- Cost: Affordable pricing makes software accessible.
- Support: Reliable customer service is important.
These criteria help businesses choose the right software. It ensures they get the best value and performance.
Credit: blog.revolutionanalytics.com
Top Contenders
In the world of data analysis, several software options stand out. These tools help analysts make sense of vast amounts of data. Let’s look at some of the top contenders.
Overview Of Leading Software
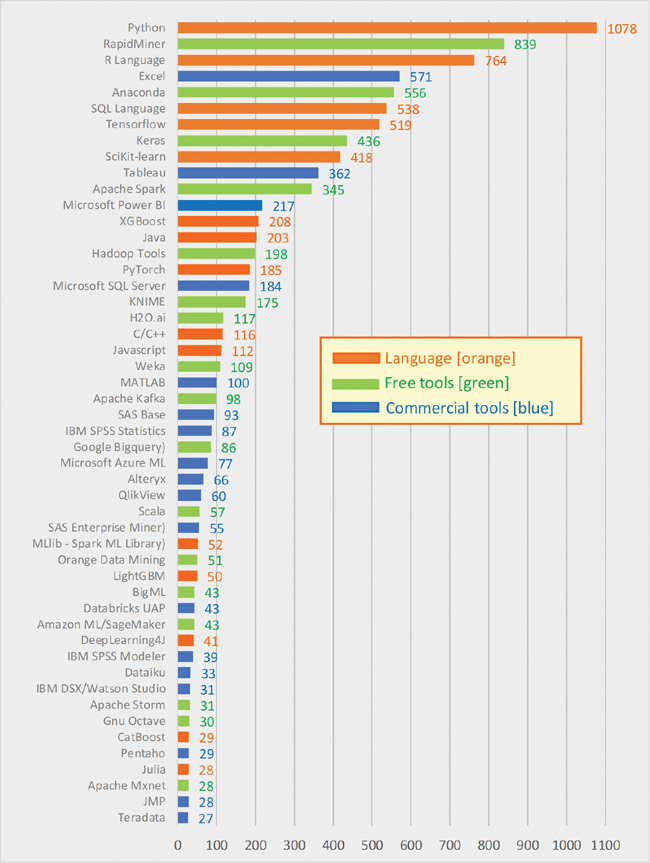
Many software programs are popular for data analysis. Each offers unique features. The leading names include Excel, R, Python, SAS, and SPSS.
Excel is widely known and used in many fields. It is easy to learn and versatile. R is favored for its strong statistical capabilities. It is open-source and free. Python is flexible and widely used in data science. It has many libraries for data analysis.
SAS is a trusted name in business and academia. It offers comprehensive tools for data management and analysis. SPSS is user-friendly and often used in social sciences. It provides a range of statistical tests and models.
Comparison Of Features
Each software has its strengths. Excel is great for simple data tasks. It offers functions and pivot tables. R is best for advanced statistics. It has many packages for specific analyses. Python is ideal for large datasets. It integrates well with other tools.
SAS excels in data handling. It is reliable and secure. SPSS is perfect for surveys and research. It simplifies complex statistical methods. Choose the right tool based on your needs. Each has unique features that can help you analyze data effectively.
Microsoft Excel
Microsoft Excel is a staple in the world of data analysis. It’s a powerful tool used by businesses, educators, and individuals. Excel provides a familiar interface for organizing, analyzing, and visualizing data. Its versatility and ease of use make it a popular choice for users at all skill levels.
Key Features
Excel offers a wide range of features that enhance data analysis. Some of the most notable include:
- PivotTables: Summarize large datasets quickly.
- Formulas and Functions: Perform complex calculations with ease.
- Charts and Graphs: Visualize data in various formats.
- Data Filtering: Sort and filter data to find specific information.
- Conditional Formatting: Highlight data based on specific criteria.
Strengths And Limitations
Excel’s strengths make it a favored tool for many data analysts. Here are some key points:
| Strengths | Limitations |
|---|---|
|
|
Despite its limitations, Excel remains a go-to tool. Its accessibility and functionality make it indispensable for data analysis tasks.
Python With Pandas
Python with Pandas has emerged as a favorite among data analysts. Python is known for its simplicity and versatility. Pandas, a library within Python, enhances data handling and analysis. Together, they offer a powerful toolset for analyzing data.
Advantages Of Python
Python is easy to learn. Its syntax resembles plain English. This makes it accessible even to beginners. Python is also open-source. Anyone can use it without cost. It has a large community. This ensures constant updates and support.
Python is versatile. It works in various domains, not just data analysis. It’s also compatible with many platforms. You can use it on Windows, macOS, and Linux. This flexibility adds to its popularity.
Why Pandas Stands Out
Pandas is a powerful data manipulation tool. It simplifies handling and analyzing data. You can easily load data from various file formats. CSV, Excel, SQL databases, and more. Pandas also provides data structures like DataFrames. These structures make data manipulation easy and intuitive.
Pandas comes with many built-in functions. These functions streamline data cleaning, transformation, and analysis. Tasks that would take hours can be done in minutes. Its ability to handle large datasets efficiently is impressive.
In summary, Python with Pandas is a strong choice for data analysis. Their combined features offer simplicity, flexibility, and power.
R Programming Language
The R Programming Language is a powerful tool for data analysis. It has gained immense popularity among data scientists and statisticians. Known for its specialized capabilities, R is widely used in various fields.
Specialized Capabilities
R offers a wide range of specialized capabilities for data analysis. It excels in statistical modeling and data visualization. Many researchers prefer R for its flexibility and comprehensive packages.
R supports complex data manipulation and transformation. It can handle large datasets with ease. The language also provides support for different types of data structures, such as vectors, matrices, and data frames.
Popular Packages
R’s popularity is partly due to its extensive collection of packages. These packages extend the basic functionality of R. Here are some of the most popular ones:
- ggplot2: This package is used for data visualization. It creates complex plots from data in a data frame.
- dplyr: A package for data manipulation. It simplifies data transformation and aggregation.
- tidyr: Helps in tidying data. It makes data more readable and easier to analyze.
- shiny: Used for building interactive web applications. It allows users to build web apps directly from R.
- caret: A package for machine learning. It includes functions to streamline model training and evaluation.
These packages enhance R’s functionality, making it a preferred choice for data analysis. Each package serves a unique purpose, addressing different aspects of data analysis. Together, they make R a versatile and powerful tool.
Credit: www.informit.com
Tableau
Tableau is a leading data analysis software. It helps businesses visualize and understand their data. It offers a range of features that make it a favorite among analysts. Below, we explore some key features of Tableau.
Visual Analytics Power
Tableau excels in visual analytics. It allows users to create stunning visualizations. These visuals help in identifying trends and patterns quickly. Tableau supports various types of charts, graphs, and maps. Users can drag and drop data to see different visual perspectives. This makes data analysis intuitive and engaging.
Complex data becomes easy to interpret with Tableau. This visual approach helps in making informed decisions. Businesses can spot opportunities and challenges at a glance. The power of visual analytics in Tableau is unmatched.
User-friendly Interface
Another strong point of Tableau is its user-friendly interface. Even beginners can navigate and use the tool effectively. The interface is clean and well-organized. Users can access features without getting overwhelmed.
Tableau’s drag-and-drop functionality is a key feature. It simplifies the process of creating visualizations. Users do not need to write code or scripts. This makes data analysis accessible to a wider audience. The software also offers guided tutorials and resources. These help users get started quickly and efficiently.
In summary, Tableau’s interface is designed with the user in mind. It combines ease of use with powerful capabilities. This balance makes it a popular choice for data analysis.
Sas
SAS (Statistical Analysis System) stands as a leading force in data analysis. Many organizations rely on its robust capabilities. It is renowned for its advanced analytics, business intelligence, and data management solutions. Below, we delve into some of its key aspects.
Statistical Analysis Strengths
SAS excels in statistical analysis and complex data manipulation. It offers a wide range of statistical techniques for data analysis, including:
- Regression Analysis
- Predictive Modeling
- Multivariate Analysis
- Time Series Analysis
Its powerful language and procedures allow users to handle large datasets efficiently. SAS’s ability to process vast amounts of data quickly makes it a favorite among statisticians and data scientists. Further, its comprehensive documentation and user support enhance its usability.
Enterprise Solutions
SAS provides robust enterprise solutions that cater to various business needs. It supports:
- Data Integration
- Data Quality
- Data Warehousing
- Business Analytics
Organizations can rely on SAS for end-to-end data management. This makes it an ideal choice for large-scale data projects. SAS’s scalability ensures it can handle the demands of growing businesses. It also integrates well with other systems, enhancing its versatility.
In conclusion, SAS’s capabilities in statistical analysis and enterprise solutions make it a top choice in the data analysis software market.
Choosing The Right Software
Choosing the right data analysis software can be challenging. There are many options available in the market. Each tool has its own features and advantages. To find the best fit, consider your specific needs and goals. This guide will help you make an informed decision.
Factors To Consider
When selecting data analysis software, several factors come into play. Here are some important ones:
Ease of Use: The software should be user-friendly. It should not require advanced technical skills. A simple interface can save time and reduce frustration.
Cost: Budget is a key factor. Some tools are free, while others are expensive. Choose a tool that fits your budget without compromising on quality.
Features: Different tools offer different features. Identify which features are most important for your analysis. This will help narrow down your choices.
Support and Documentation: Good support and documentation can be very helpful. Look for software with a strong support community. Comprehensive documentation can also be a great asset.
Matching Needs With Tools
Every data analysis task is unique. Matching your needs with the right tool is crucial. Here are some common needs and suitable tools:
Basic Analysis: For simple tasks, tools like Excel or Google Sheets are excellent. They are easy to use and widely available.
Advanced Analysis: For more complex analysis, consider tools like Python or R. They offer powerful libraries and extensive functionalities.
Visualization: If you need to create visual reports, Tableau or Power BI are great choices. They excel at turning data into visual insights.
Big Data: For handling large datasets, Apache Hadoop or Spark is suitable. They are designed to process massive amounts of data efficiently.
By considering these factors and matching your needs with the right tools, you can choose the best data analysis software for your projects. This approach ensures you have the right tool to achieve your goals effectively.
Future Trends In Data Analysis Tools
Data analysis tools are rapidly evolving, with Python-based software leading the pack. Its popularity stems from versatility and ease of use.
The future of data analysis tools is full of exciting possibilities. Rapid technological advancements shape how we collect, interpret, and leverage data. This evolution promises more efficient, accurate, and user-friendly tools.Emerging Technologies
New technologies are transforming data analysis. Artificial intelligence (AI) and machine learning (ML) lead this change. These technologies help automate complex tasks. They also enhance predictive analytics. Cloud computing is another significant trend. It offers scalable resources for data storage and processing. This ensures faster access and real-time analysis. Blockchain technology secures data integrity. It prevents unauthorized alterations.Impact On Data Analysis
These emerging technologies impact data analysis profoundly. AI and ML improve decision-making. They identify patterns and trends in large datasets. This enables more accurate predictions. Cloud computing offers flexibility. It reduces costs and enhances collaboration. Teams can access data anytime, anywhere. Blockchain ensures data security. It builds trust in data integrity. As these technologies evolve, data analysis tools will become more powerful. They will offer better insights, enabling informed decisions. This will benefit businesses, researchers, and analysts alike.Frequently Asked Questions
What Is The Leading Data Analysis Software?
The leading data analysis software is Microsoft Excel. It is widely used due to its versatility, user-friendly interface, and powerful functions.
Why Is Python Popular For Data Analysis?
Python is popular for data analysis because it is easy to learn, has extensive libraries like pandas and NumPy, and supports data visualization tools.
How Is R Used In Data Analysis?
R is used in data analysis for statistical computing and graphics. It offers extensive packages for data manipulation, calculation, and graphical display.
What Are The Benefits Of Using Sas?
SAS offers advanced analytics, multivariate analyses, business intelligence, data management, and predictive analytics. It is known for its robust and reliable performance.
Conclusion
Choosing the right data analysis software is crucial for effective results. Popular options include Excel, Python, and R. Each has unique features and benefits. Excel is user-friendly. Python offers powerful libraries. R excels in statistical analysis. Consider your needs and skills before making a choice.
Your decision impacts your data analysis success. Stay updated as software evolves. Happy analyzing!