
Statistical analysis tools help make sense of complex data. They transform raw numbers into meaningful insights.
In today’s data-driven world, understanding patterns and trends is crucial. Businesses, researchers, and analysts use statistical tools to make informed decisions. These tools help uncover hidden insights, validate theories, and predict future outcomes. Whether you are optimizing marketing strategies or conducting scientific research, statistical analysis is essential.
It enables you to analyze data accurately and draw reliable conclusions. Knowing how to use these tools can significantly impact your success. This blog will explore the use and importance of statistical analysis tools. Dive in to discover why they are indispensable in various fields and how they can aid your decision-making processes.
Introduction To Statistical Analysis Tools
Statistical analysis tools help in understanding data patterns and making informed decisions. They are essential for research, business, and daily life.
Statistical analysis tools help us understand data. They show patterns and trends. We can make better decisions with these tools. Many fields use them. Business, science, and education are a few examples.Purpose And Scope
Statistical analysis tools serve many purposes. They help analyze large data sets. They also simplify complex data. These tools can predict future trends. They identify correlations between variables. The scope is broad. From business forecasts to scientific research, their use is vast. They support decision-making processes.Significance In Modern Data
Modern data is vast and complex. Statistical analysis tools make sense of this data. They help turn raw data into useful information. Businesses use these tools to find market trends. Scientists use them to draw conclusions from experiments. Educators use them to evaluate student performance. The importance of these tools cannot be overstated. They are essential in today’s data-driven world. “`Types Of Statistical Analysis Tools
Statistical analysis tools help us understand data. They are essential in research, business, and science. These tools fall into two main categories: descriptive and inferential. Each category has its own purpose and methods.
Descriptive Tools
Descriptive tools summarize and describe data. They help you understand what the data shows. Common descriptive tools include:
- Mean: The average of a data set.
- Median: The middle value in a data set.
- Mode: The most frequent value in a data set.
- Standard Deviation: Measures data spread around the mean.
These tools give quick insights into data trends. They show central tendencies and variability. Descriptive tools are often the first step in data analysis.
Inferential Tools
Inferential tools help draw conclusions from data. They make predictions and test hypotheses. Common inferential tools include:
- T-tests: Compare means between two groups.
- Chi-square Tests: Examine relationships between categorical variables.
- Regression Analysis: Predict the value of one variable based on another.
- ANOVA (Analysis of Variance): Compare means among three or more groups.
These tools help make decisions based on data. They are crucial in scientific research and business strategy. Inferential tools allow you to understand data patterns and relationships.
Both descriptive and inferential tools are vital. They provide a full picture of data analysis. Use them together for the best results.
Key Benefits Of Statistical Analysis
Statistical analysis tools help businesses and researchers make sense of data. They turn raw numbers into insights. These tools offer several key benefits that drive informed decisions and strategic planning.
Data-driven Decision Making
Businesses use data to guide their choices. Statistical analysis tools provide a clear view of what’s happening. With accurate data, companies can avoid guesswork.
For example, managers can see which products are selling well. They can also spot areas needing improvement. This makes it easier to allocate resources wisely.
Here are some benefits:
- Improved accuracy in forecasting
- Better resource management
- Reduced risk of costly mistakes
Identifying Trends And Patterns
Statistical tools reveal trends and patterns in data. These insights are crucial for long-term planning. They help businesses understand market movements and customer behavior.
For instance, a company can identify seasonal sales trends. It can also detect changes in customer preferences over time. This information is valuable for developing new products and services.
The benefits include:
- Enhanced understanding of market trends
- Informed product development
- Improved marketing strategies
Statistical analysis tools offer many advantages. They help businesses make better decisions and understand their data. This leads to smarter strategies and successful outcomes.

Credit: fastercapital.com
Use In Business And Finance
Statistical analysis tools play a crucial role in business and finance. They help companies make informed decisions. By analyzing data, businesses can predict trends and plan strategically. This reduces risks and increases profitability.
Market Analysis
Market analysis is essential for any business. It helps understand customer needs and market trends. Statistical tools analyze sales data and customer behavior. This helps in identifying profitable products and services. Companies can also find new market opportunities. They can adjust their marketing strategies based on data insights. Businesses can stay ahead of competitors by making data-driven decisions.
Risk Assessment
Risk assessment is vital in finance. Statistical tools help in predicting financial risks. They analyze historical data and identify potential threats. This helps in minimizing losses and maximizing returns. Companies can make better investment decisions. They can also allocate resources more efficiently. Proper risk assessment ensures financial stability and growth. It helps in maintaining investor confidence and protecting business assets.
Application In Healthcare
Statistical analysis tools play a crucial role in healthcare. They help professionals make sense of complex data. This data can come from patient records, clinical trials, and more. By analyzing this data, healthcare providers can make better decisions. These decisions can lead to improved patient care and outcomes.
Predictive Analytics
Predictive analytics uses past data to forecast future events. In healthcare, it can predict disease outbreaks. It can also forecast patient admission rates. This helps hospitals prepare and allocate resources effectively. Predictive analytics can even identify patients at risk of serious conditions. This allows for early intervention and better management of diseases.
Patient Outcomes Improvement
Statistical analysis tools help improve patient outcomes. They analyze treatment effectiveness and patient responses. This data helps doctors personalize treatment plans. Personalized plans lead to better patient recovery and satisfaction. These tools also help in tracking long-term patient progress. Continuous monitoring ensures that the treatments remain effective.
Role In Scientific Research
Statistical analysis tools play a crucial role in scientific research. They help researchers design experiments, test hypotheses, and interpret data. These tools ensure that scientific findings are accurate and reliable.
Experiment Design
Effective experiment design is critical for meaningful research. Statistical tools assist in structuring experiments to eliminate biases. They help select the right sample size and ensure randomization. This way, results are more likely to be valid and reproducible.
For example, using a tool like ANOVA (Analysis of Variance), researchers can compare multiple groups. This helps in understanding the effect of different variables. Here’s a simple representation:
| Group | Sample Size | Mean |
|---|---|---|
| Control | 30 | 5.2 |
| Experimental A | 30 | 6.8 |
| Experimental B | 30 | 7.1 |
Hypothesis Testing
Hypothesis testing is a key part of scientific research. It determines whether a hypothesis is supported by data. Statistical analysis tools like t-tests and chi-square tests are commonly used.
These tools help researchers make decisions based on sample data. For instance, a t-test can compare the means of two groups to see if they are statistically different. This is essential for validating experimental results. Consider this example:
- State the null hypothesis (H0).
- Collect and analyze data.
- Calculate the test statistic.
- Determine the p-value.
- Accept or reject H0 based on the p-value.
By following these steps, researchers can draw meaningful conclusions. This process ensures that their findings are based on evidence.
Impact On Technology And Engineering
Statistical analysis tools play a crucial role in technology and engineering. These tools help in understanding data patterns and making informed decisions. Engineers and technologists use these tools to improve processes, enhance product quality, and optimize performance.
Quality Control
Quality control is vital in technology and engineering. Statistical analysis tools help identify defects and variations in manufacturing processes. By using methods like control charts and histograms, engineers can monitor production quality.
For example, a control chart can show if a process is stable or if there are issues. This helps in maintaining consistent quality. Here’s a simple table to illustrate:
| Tool | Purpose |
|---|---|
| Control Chart | Monitor process stability |
| Histogram | Identify frequency distribution |
Performance Optimization
Performance optimization is another critical area. Engineers use statistical tools to improve system efficiency. Tools like regression analysis and design of experiments (DOE) provide insights into performance improvements.
Regression analysis helps in understanding the relationship between variables. It predicts outcomes and guides improvements. DOE helps in designing efficient tests and experiments. This ensures optimal performance with minimal resources.
Here are some key tools used:
- Regression Analysis: Predict outcomes and improve processes.
- Design of Experiments (DOE): Efficiently test and optimize performance.
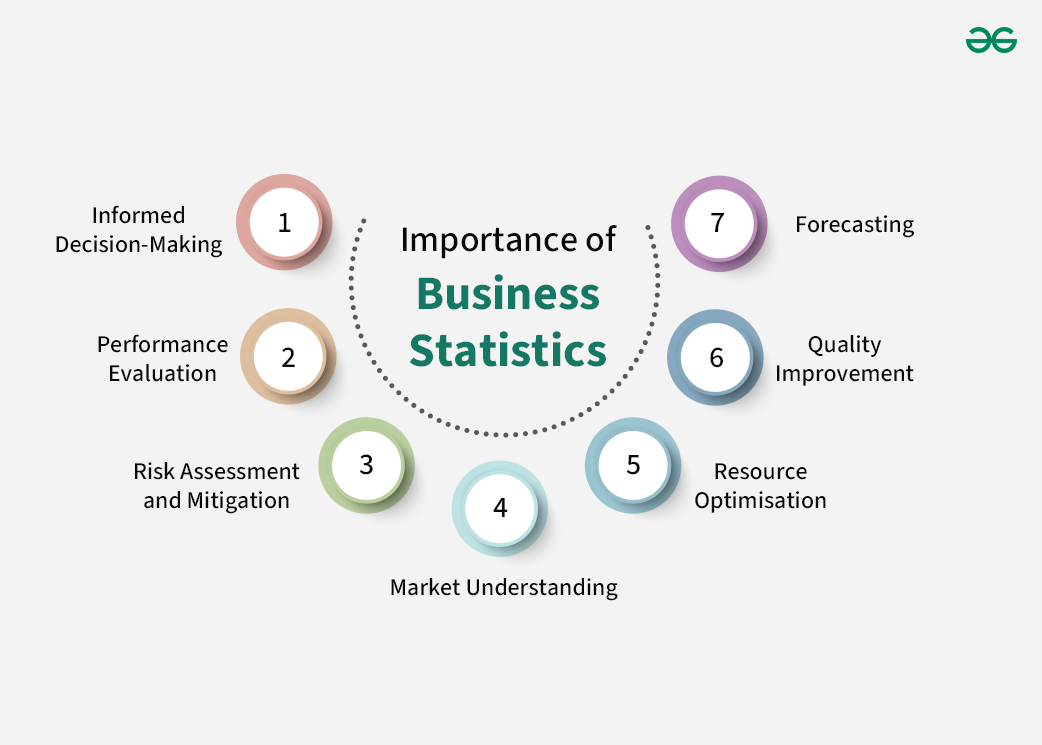
Credit: www.geeksforgeeks.org
Future Trends In Statistical Analysis Tools
The future of statistical analysis tools is bright and evolving rapidly. As technology advances, these tools become more powerful and accessible. This transformation is driven by several emerging trends.
Integration With Ai And Ml
Statistical analysis tools are increasingly integrated with Artificial Intelligence (AI) and Machine Learning (ML). This integration allows for more accurate predictions and insights. AI and ML enhance the ability to analyze large data sets quickly. They can automate complex tasks and uncover patterns that humans might miss.
For example, AI algorithms can process customer data to predict buying behavior. ML models can help identify potential risks in financial data. These integrations make statistical tools more effective and valuable.
Increased Accessibility And Use
Statistical analysis tools are becoming more user-friendly and accessible. This trend makes these tools available to a wider audience, not just data scientists. User-friendly interfaces and simplified functionalities allow more people to perform data analysis. Small businesses and individuals can now use these tools without needing extensive training.
Several factors contribute to this increased accessibility:
- Cloud-based solutions: Many tools are now available online, reducing the need for expensive hardware.
- Open-source platforms: Free and open-source statistical tools are widely available, providing cost-effective options.
- Educational resources: Online courses and tutorials help users learn how to use these tools effectively.
These advancements ensure that statistical analysis is no longer limited to experts. Anyone with an interest in data can now explore and analyze it.

Credit: www.newtonx.com
Frequently Asked Questions
What Are Statistical Analysis Tools?
Statistical analysis tools are software or applications that help analyze data. They perform complex calculations, visualize data, and identify patterns.
Why Use Statistical Analysis Tools?
Statistical analysis tools simplify data interpretation. They enable accurate predictions, enhance decision-making, and uncover hidden insights in data.
How Do Statistical Tools Improve Research?
Statistical tools streamline data processing. They ensure precise results, reduce human error, and support robust data analysis in research.
Which Industries Benefit From Statistical Tools?
Industries like healthcare, finance, marketing, and engineering benefit. These tools help in data-driven decision-making and trend analysis.
Conclusion
Statistical analysis tools are essential in today’s data-driven world. They help make informed decisions. Businesses gain insights from complex data easily. These tools also improve accuracy and efficiency. People can understand trends and patterns better. They are vital for research and development.
With them, predicting outcomes becomes simpler. Overall, statistical analysis tools support smarter choices. They are a valuable asset for any field. Embrace their use for better results.